The ROI of Crop Monitoring Tools: What Farm Businesses Should Know
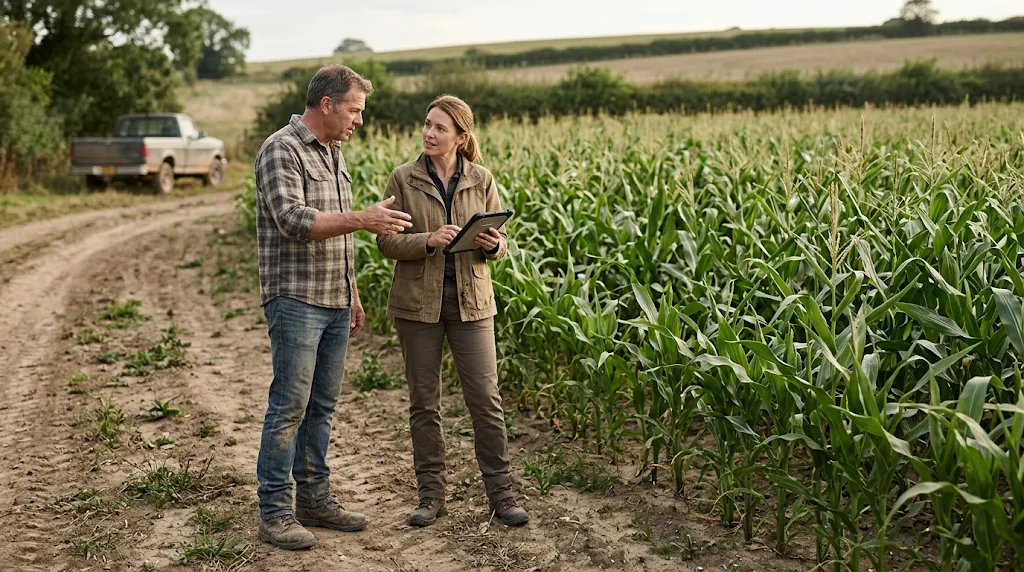
A crop monitoring platform can show where a field is changing. A soil sensor can indicate when irrigation may be needed. Neither creates a financial return simply by collecting data. The return begins when the information changes a decision in time to protect revenue or reduce a real cost.
The ROI of crop monitoring tools therefore depends on the management problem, the farm's ability to respond, and the complete cost of the workflow. For farm businesses evaluating an investment, the strongest starting point is a defined decision and a realistic comparison with current practice, not a promised percentage increase in yield.
Where Crop Monitoring Tools Can Create Value
Crop monitoring covers several technologies: satellite and drone imagery, soil moisture sensors, crop canopy sensors, and software that organizes observations and supports decisions. Their capabilities differ, so their business cases should differ too.
A useful investment proposal connects three elements: an observation, an available response, and a measurable financial consequence.
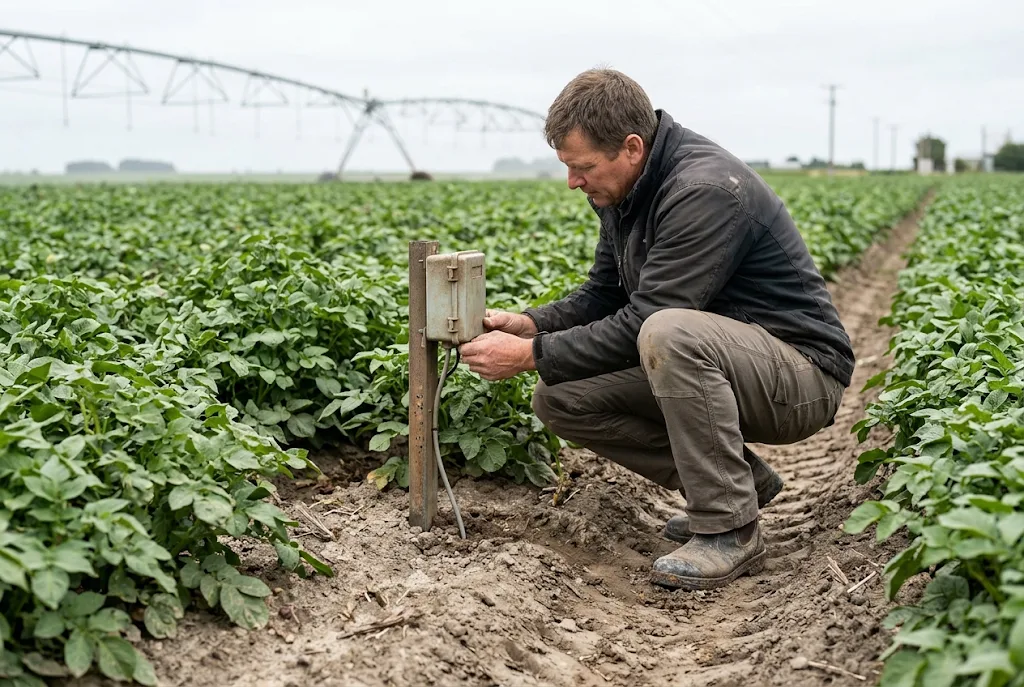
For example, soil moisture measurements can inform irrigation scheduling. If the resulting schedule avoids unnecessary pumping while maintaining crop performance, the relevant benefits may include lower energy expenditure and reduced water charges where those charges apply. A soil reading by itself is not the saving.
Similarly, aerial imagery can identify planter skips, uneven crop growth, and damaged areas. Its financial value depends on what follows: confirming an equipment issue, targeting an inspection, or making a justified management adjustment. Not every visible difference is correctable, and not every inspection leads to treatment.
Potential benefits fall into four groups:
- Input savings: documented reductions in fertilizer, irrigation, or crop protection expenditure.
- Protected crop value: additional saleable production or quality supported by a credible comparison.
- Operating efficiency: reduced travel, avoidable fieldwork, or staff time with a demonstrable business use.
- Better allocation: directing limited attention, machinery, or treatment capacity toward the fields that need it most.
Keep these categories separate. An earlier alert and an avoided yield loss may describe the same benefit, not two benefits to add together.
Match the Monitoring Method to the Decision
The best tool is the one that provides sufficient information at the right time. Paying for greater resolution or more frequent observations has little justification if those features do not improve the decision.
Imagery sources involve trade-offs. Drones can provide detailed views and flexible capture timing, but battery endurance and operating effort affect coverage. Optical satellite imagery offers broader coverage and historical records, while clouds can prevent a useful observation during a critical window.
Soil sensors involve a different sampling problem. A stationary sensor represents its installation location, not every soil condition across the farm. University extension guidance recommends monitoring representative locations and depths, with separate consideration of contrasting soil types.
Before comparing vendors, write a short requirement: the crop, decision window, minimum information needed, and person responsible for acting. This makes it easier to compare services on usefulness rather than dashboard appearance.
Calculate ROI Against Current Practice
The appropriate baseline is what the farm would realistically do without the new tool. That may include existing scouting, advisory services, irrigation records, and manual checks. Comparing a new system against no management at all can exaggerate its value.
Build a Partial Budget First
A partial budget examines the revenues and costs that change because of the investment. It does not require rebuilding every farm account.
Use the following relationship:
Annual operating net benefit = added revenue + reduced costs − added operating costs − lost revenue
Added operating costs should include the recurring monitoring charges and the cost of responding to the information. If a platform prompts additional inspections or treatments, include them. If it replaces an existing service, include the expenditure genuinely removed.
Value additional production using the relevant saleable output and price, then deduct associated harvesting, handling, and marketing costs. Otherwise, an increase in gross crop value can be mistaken for an equivalent increase in profit.
Distinguish Payback From Return
For an upfront purchase with a reasonably stable positive annual operating benefit:
Simple payback period = incremental upfront investment ÷ annual operating net benefit
Payback indicates how long the initial outlay would take to recover under those assumptions. It does not account for the time value of money, benefits after recovery, or changing annual results.
For a subscription-only service, assess whether its recurring cost is covered by incremental benefits each season. There may be no substantial capital outlay to recover.
When reporting an ROI percentage, state the period and calculation. A first-season figure, a multiyear cumulative return, and an annual accounting return are not interchangeable. For a larger investment, compare discounted cash flows over a realistic planning horizon, including replacement costs and a defensible residual value.
Avoid double counting ownership costs. A cash-flow analysis includes the purchase outlay; adding depreciation as another cash outflow would count the asset cost again. Keep the method consistent with the decision being evaluated.
An Illustrative Payback Example
Consider a hypothetical farm using a monitoring workflow across 1,000 eligible hectares. Assume a pilot supports annual gross benefits of $8 per hectare, producing $8,000 before additional operating costs. If annual software, servicing, and extra labor total $3,000, annual operating net benefit is $5,000.
With an incremental upfront investment of $15,000, simple payback would be three years. These figures are illustrative assumptions, not observed results or industry benchmarks.
The next question is whether those assumptions remain credible. If the benefits occur on only part of the eligible area or the workflow needs more staff time, payback lengthens. A favorable calculation is useful only when its inputs are defensible.
Include the Costs That Quotes Often Leave Outside the Headline Price
The subscription or sensor price is only part of the budget. Request an itemized proposal and build a separate estimate of internal costs.
Include applicable expenditure for:
- Equipment, installation, mounting, and initial configuration.
- Data loggers, communications, connectivity, and software access.
- Calibration, maintenance, consumables, and replacement.
- Training, seasonal setup, and troubleshooting.
- Image capture, processing, agronomic interpretation, and support.
- Data transfer, integration, and export.
- Staff time reviewing alerts and checking fields.
- Machinery or service capacity needed to execute recommendations.
Distinguish cash savings from released capacity. Saving employee hours may improve workload management without reducing payroll. Count a direct labor saving only where expenditure falls; describe the value of redeployed time separately unless it can be demonstrated.
Likewise, lower water use does not automatically create an equal monetary saving. The financial result depends on pumping costs, charging arrangements, and whether other expenses change. Avoid assigning a market value to every environmental improvement unless that value is actually available to the business.
For systems shared across enterprises, allocate costs consistently. Do not charge the full investment to one crop while claiming all cross-farm benefits elsewhere.
Why Evidence and Returns Vary Between Farms
Monitoring tools operate inside an existing management system. If that system already makes good decisions, the scope for improvement may be modest. If information arrives after the response window, even an accurate observation can have little immediate financial value.
A 2025 study of sensor-based nitrogen management illustrates why crop-specific evidence matters. Across 17 on-farm experiments in Nebraska during 2021–2023, sensor-guided management reduced average nitrogen use in corn without a statistically significant overall yield penalty. Results in wheat were less decisive, with no statistically significant overall differences in nitrogen rate, yield, or nitrogen use efficiency.
The study's economic comparison also excluded variable-rate technology costs. Its findings therefore support the potential value of a sensor-guided management approach under particular conditions, not a complete return-on-investment claim for purchasing the equipment.
This distinction should guide vendor evaluation. Ask whether a reported result measures:
- Detection or measurement accuracy.
- An agronomic response, such as fertilizer reduction.
- Partial profit before technology costs.
- Whole-workflow net benefit after relevant expenses.
Those outcomes answer different questions. A more accurate measurement is not automatically a more profitable decision.
Also examine response capacity. Can the farm irrigate when the information indicates a need? Can its applicator deliver the recommendation? Is someone available to verify an unusual image pattern? Budget constraints, equipment limitations, and staffing can interrupt the path from observation to benefit.
Treat avoided losses cautiously. A monitoring alert does not establish the amount of production that would otherwise have been lost. Where risk reduction is plausible but unmeasured, describe it as an additional consideration rather than a guaranteed annual credit.
Use a Pilot to Establish a Defensible Business Case
A pilot should test the proposed workflow against normal practice under representative conditions. It should not merely demonstrate that the software displays data.
Start with one recurring decision, such as irrigation timing, in-season nitrogen management, or prioritizing crop inspections. Agree on success measures before the season and document the baseline.
Record the chain from information to outcome:
- What the tool observed and when it became available.
- What the farm would normally have done.
- Whether a field check confirmed the observation.
- Which decision changed and who approved it.
- The actual input, labor, or machinery difference.
- The resulting crop performance and any corrective work.
For agronomic comparisons, use matched areas or replicated treatment strips where feasible, with appropriate advisory support. A comparison with last year's yield alone cannot separate the tool's contribution from weather, crop choice, or other management changes.
Evaluate more than one set of conditions before extrapolating a result across the business. Include fields that reflect ordinary soil variability and workload, not only those most likely to show a benefit.
Finally, prepare conservative, expected, and favorable budgets. Vary eligible area, response costs, input prices, and supported production benefits. The test is resilience: does the proposal remain acceptable when benefits are smaller or costs higher than expected?
Invest in a Better Decision, Not Just Better Visibility
Crop monitoring tools can earn their place when they help a farm act more effectively than its current system. That requires useful observations, credible interpretation, practical response capacity, and financial records that distinguish measured benefits from assumptions.
Before committing, request a documented assessment built around one defined management decision. Compare the full workflow with existing practice, verify the outcome through a representative pilot, and expand only where the evidence supports the investment. A clear, modest return is a stronger business case than an impressive dashboard paired with benefits nobody can substantiate.